

The scenario
When I was growing up, my mom used to tell me that if I sat too close to the TV, my eyes would get glued to the screen. I believed her, and chose my distance from the set accordingly.
You might read that and think, “Wow, John sure is gullible” amongst other things, I’m sure. Thinking back on this, I choose to consider the experience informative rather than embarrassing. As time went on, my six-year-old self gathered more and more information (sitting closer and closer to the TV, more and more frequently) and I realized my Mom’s advice was false – I could sit as close to the TV as I wanted and my eyes would be just fine.
You may be asking yourself how this relates to downhill turf racing at Santa Anita Park.
I’ll get to that in a minute.
Turf racing at Santa Anita offers a unique opportunity in the downhill turf course, the only one of its kind in the world. Over time, horseplayers have come to accept certain theories as gospel when it comes to the downhill.
One of those is that:
The inside post position for downhill turf races is a disadvantage.
Given the unique configuration, a slight right-hand turn, followed by a sweeping left-hand one, this makes intuitive sense, especially in large fields. But rather than take this conventional wisdom on its face, I, like my six-year-old self before me, decided to do some testing.
Take a look at what I’ve put together below – hopefully it can help provide a more nuanced point of view and assist you when wagering your hard-earned dollars on the downhill.
Background
Here are some high-level stats on the racing at Santa Anita on the downhill turf course since December 26th 2015:
| Number of races | Number of race runners | Runners per race |
|---|---|---|
| ~450 | ~4050 | ~9 |
Analysis
Definitions
Through the rest of the article, we will analyze the races from a number of different viewpoints based on impact values.
| Term | Definition |
|---|---|
| Win percentage | Total number of wins divided by total number of starters |
| Takeout | The percentage of money the racetrack takes to cover racing (it’s around 16% for win wagers) |
| Odds adjusted win percentage | One divided by one plus odds of a horse – then multiply that by the one minus the takeout rate |
| Impact value | Win percentage divided by odds adjusted win percentage |
| Return on $1 | The amount of money returned by playing one dollar consistently on the plays listed below |
The rationale for odds adjusted win percentage is to reduce the impact that longshots (horses that are unsuited, potentially for a race) have on losing from any given perspective (be it post position, weight, or anything else that is included below).
The way to think about impact values:
Numbers less than one mean that horses win less than the public expects, and numbers greater than one mean that horses win more than the public expects them to. The takeaway being numbers higher than one might represent pockets of opportunity or overlays. It’s another take on any given play’s return on investment
Post position
The main question that we sought to answer was:
Does post position impact a horse’s chances in downhill races at Santa Anita?
The answer to the question might help handicappers avoid making choices that lean toward the outside in all cases, as one might who chose to follow the conventional wisdom.
The approach to getting an answer to the above question is as follows:
- We split the races into three groups:
- Races with 7 or fewer runners
- Races with 8 or 9 runners (the average # of runners)
- Races with 10 or more runners
- We broke the horses into three groups within the grouped races:
- Horses posted on the rail
- Horses posted either the furthest from the rail, or second furthest
- All other horses
- We calculated actual and odds adjusted win percentages
The results are as follows:

The main takeaway that I would hope everyone comes away with here is that only in races with 10 or more runners does there appear to be a major distinction between the rail, and outside posts in terms of win advantage. However, deaveraging the races the way that we chose uncovered that this is not a truth in all situations. It is my hope that especially in races with fewer runners, this might give people cause to pause before leaning toward an outside runner just because they have heard that the outside is advantaged.
Running style
I was also curious to see how running style might affect performance down the hill:
Does a horse’s initial position in a race impact significantly its ability to win?
Running styles (which are included in some PPs) can easily be used to get a feel for who might stride out to be the leader, who might press, etc. Therefore, the answer to the question above could help handicappers make choices between horses in downhill turf races at Santa Anita.
The methodology for this analysis is as follows:
- We look at the how each horse in each race at Santa Anita ran up to the quarter and half mile markers.
- We group horses into four different buckets:
- Lead: horses on the lead at the respective points of call
- Just off pace: horses that are pressing the pace setter (< 1 length)
- Mid pack: horses that are more than 1 length from the pace setter, but a maximum of 3 lengths away from the pace setter
- Far back: horses that are more than three lengths from the leader
- Calculate impact values as above
The results are shown in the table below:

The above table clearly shows that horses that were able to establish the lead were more likely to win than their odds suggested, and horses that were far back were less likely to win than their odds suggested. This analysis does not look at how horses previously ran, but how they ran on the given race day. However, those using past running lines to understand how the pace is likely to unfold should benefit from the analysis above. I think many will be surprised that the downhill, often thought to be play like a turf mile, has stats regarding running style that look very similar to how dirt sprints typically play.
Jockeys
As I started to get into some of the data, I wanted to see how far we could take the overall analysis of Santa Anita races on the downhill turf course.
I always like to take a look at the jockey percentages that are listed in the PPs that I purchase when I am playing the races. Jockey win percentages are good, especially early on in meets, to understand who is hot, and who might not be. However, I have always found this to lack specificity.
Questions that pop into my head sometimes include:
- Is there a particular jockey who is a sprint specialist?
- Is there a jockey who is terrible on the turf?
And the list goes on from there.
PPs lack these type of statistics, so I thought it might be informative to take a look at how the jockeys that ride in California fare on the downhill turf course.

Surprisingly, Joel Rosario, and Mike Smith (two of the better riders in California) fall well below an impact value of 1, signaling they lose more than the parimutel market thinks that they should – perhaps because they are overbet based on the brand value of their names. Conversely, Flavien Prat, Geovanni Franco and Edwin Maldonado each have over 100 mounts and boast an impact value that is greater than 1 suggesting they win more often than the odds of their horses might suggest they should.
Trainers
I applied the same logic above to trainers. Trainers get a little bit more attention paid to them in PPs (e.g. in maiden races, where a trainer is saddling a first-time starter, a statistic for a trainers record with first time starters is shown), but nothing more highly tailored to the given situation. Again, given the uniqueness of the downhill turf course, I thought it might help handicappers to see a more specific analysis of trainers.
A chart showing trainer impact values is below:
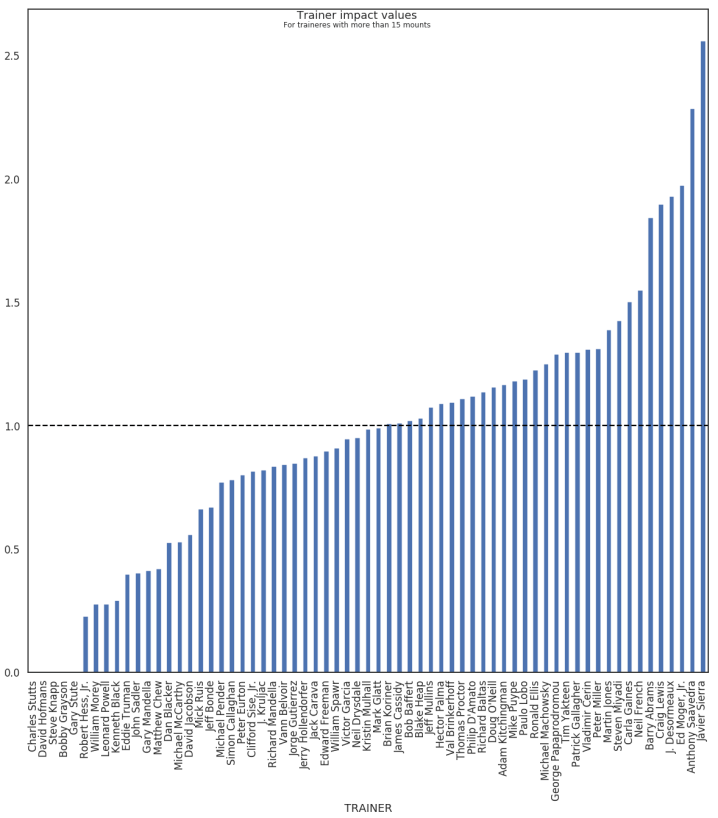
Interestingly, Keith Desormeaux boasts a massive impact value of almost 2 from 35 starts. Peter Miller sits at 1.3 with over 240 starts and close to a 23% win percentage. At the other end of the spectrum, John Sadler has saddled about 150 horses, wins just 5% of the time, and has an impact value of 0.4, well below 1.
Cutbacks
Another interesting phenomenon we wanted to study were horses changing distances from their previous start, to their current start down the hill at about 6.5 furlongs. One of the primary ideas here is that a cutback in distance might help a runner improve, and that effect might be exaggerated on this unique course.
Once again, we employed impact values to try to understand. The chart is below:

What is interesting in this chart is that horses that are either cutting back from 7 furlongs, or stretching out from 5.5 to 6 furlongs appear to win at a higher rate than their odds might suggest that they should.
Taking that further, we also looked at horses who were cutting back from a route to the sprint down the hill, and who pressed the pace or were on the lead. Those horses won just 2 of 21 races, and lost significantly more than their odds suggested they should have (impact value of 0.66). For horses that were cutting back, did not attend the pace, but were less than 3 lengths behind the pacesetter, the win percentage was slightly higher at 12% (12 for 98), but the impact value was still below one.
This suggests that there is not necessarily an edge to be had in horses who are expected to be forwardly placed, and are cutting back in distance having previously run a route (1 mile or more)
Weights
Weights have always baffled me. I am not quite sure how to think about a horse carrying an apprentice jockey who is allowed 10 pounds (e.g. the horse carries 10 pounds less than other horses) or horses who are carrying less weight because they meet a condition in the race (e.g. have not won a race in the past X amount of time). In theory, I would imagine that carrying more weight might have an impact on how tired a horse gets through the duration of the race (imagine running a 5k with and without a backpack full of textbooks… how might you think your results would differ?)
The methodology is as follows:
- Split races into three groups based on how varied the weights are. The rationale behind this is that MSW races will have horses that are all the same weight, whereas other races with conditions, and optional claiming might have horses with more weight dispersion. I calculated the variance of weights for each race, and bucketed all races into low, medium and high variance in weights.
- Find the maximum weight horse in the field
- Determine for each horse how much less than the maximum in the race horse weighs
- Group the horses by how much less than the maximum they weigh
- Calculate the impact values for weights less than the maximum in increments of 1 pound (e.g. 1 pound less, 2 pounds less, etc.)
The table below shows my findings.

As you might expect, there is not much to be made of weight in low to medium variance races.
However, I am not entirely sure how to interpret the massive impact value of a horse carrying 8 pounds less than the top weight in races with high variances of weights. Getting a weight allowance of 8 pounds suggests that there is an apprentice jockey on the horse, so that might be a consideration to take into account during handicapping. Perhaps bettors assume an apprentice will be disadvantaged riding the downhill but then overcompensate when it comes to betting?
Time off
Finally, I wanted to look at time between races. Statistics presented in PPs or by handicappers, in my mind, are oddly and/or arbitrarily defined. Is there really a significant difference between a horse having 30 days off and 32 days off? The stats in PPs would have you believe that…
As a result, I ended up taking an approach that seemed more intuitive in which I defined time off on a weekly basis, and then as those weeks turned into months, grouped by months.
The results for this are in the table that follows:

As it turns out, my skepticism proved wrong. There appears to be no significant difference in the terms of impact values, between 4, 5, 6, 7 or 8 weeks off.
The takeaway that I have from this is:
- Horses coming off less than a week of rest are a pretty bad bet.
- 1 to 2 weeks of rest between starts appears to be optimal
- Otherwise, the layoff doesn’t matter and probably is highly dependent on a number of other factors (like trainer ability, workouts, horses in the field, etc.)
Conclusion
I can’t wait for the next Franco-ridden, Desormeaux-trained frontrunner who draws the rail coming back in two weeks on the downhill. Seriously, though, this exercise wasn’t meant to be a magical exercise in finding the perfect bet, rather a way to look at downhill races from a data perspective. I hope you’ve enjoyed reading it as much as I’ve enjoyed writing it, and you’ll find more data-driven analysis from me in this space soon.
Special shout out to one of the inaugural In the Money Players’ Podcasts that PTF and JK did that inspired this whole thing (reference show number 6, around 49 minutes in)!
Bio for John Camardo

My personal horse racing “career” did not begin until 2017, as I never lived near a racetrack before moving to New York city. As a result, I did not have a family member of friend to teach me how to handicap, and relied on podcasts (again, shout out PTF and JK), books (also shout out PTF and Andy Beyer), simulcast shows (analysts for tracks providing race by race analysis – thank you NYRA), and admittedly Googling terms, to learn how to handicap. I must admit I started by only betting to show (as I had no clue what I was doing). But the world of racing, and the vast data it provides quickly sucked me in, and now I am a true degenerate (no more show wagers, almost exclusively win, and exactas, and dipping my toe into the multi-race wagers thanks to Steve Byk’s new Game Builder segment with Nick Tammaro). Unfortunately, ROI of just under $2.00 for the year, but still a significant improvement from last!
I grew up in a small town called Auburn New York, attended college at Cornell University studying Operations Research and Information Engineering and subsequently moved to New York City to be a business and strategy analyst, and recently became a product manager, all at a top bank.
My favorite weekend activity is parking on the couch and gambling all day until my girlfriend Emilia yanks me out of degenerate mode to go out / go to dinner (though little does she know sometimes I finish the card at Santa Anita and start gambling on Australia / Yonkers during “bathroom breaks”).


Very informative, somewhat surprising article regarding down the hill turf racing. The down hill turf race used to be my favorite SA race. Lately had become almost inscrutable. Your article has given me new hope that my once favorite race can once again be playable. Thank you for doing the research and for sharing your findings.
Thanks for the note, Ed! Let us know if you have any questions.
In my experience, weight differentials manifest themselves more during the acceleration part of a race than in the overall race time. The advantage is tactical.
That’s why you will usually see that over course & distances that favour speed, apprentices do especially well because they can reach maximum speed a bit sooner (try running up the stairs with and without a bag containing a 2liter bottle of water on your back … you will surely notice the difference!).